Building a reactive Auto-Scaling engine for cloud Microservices
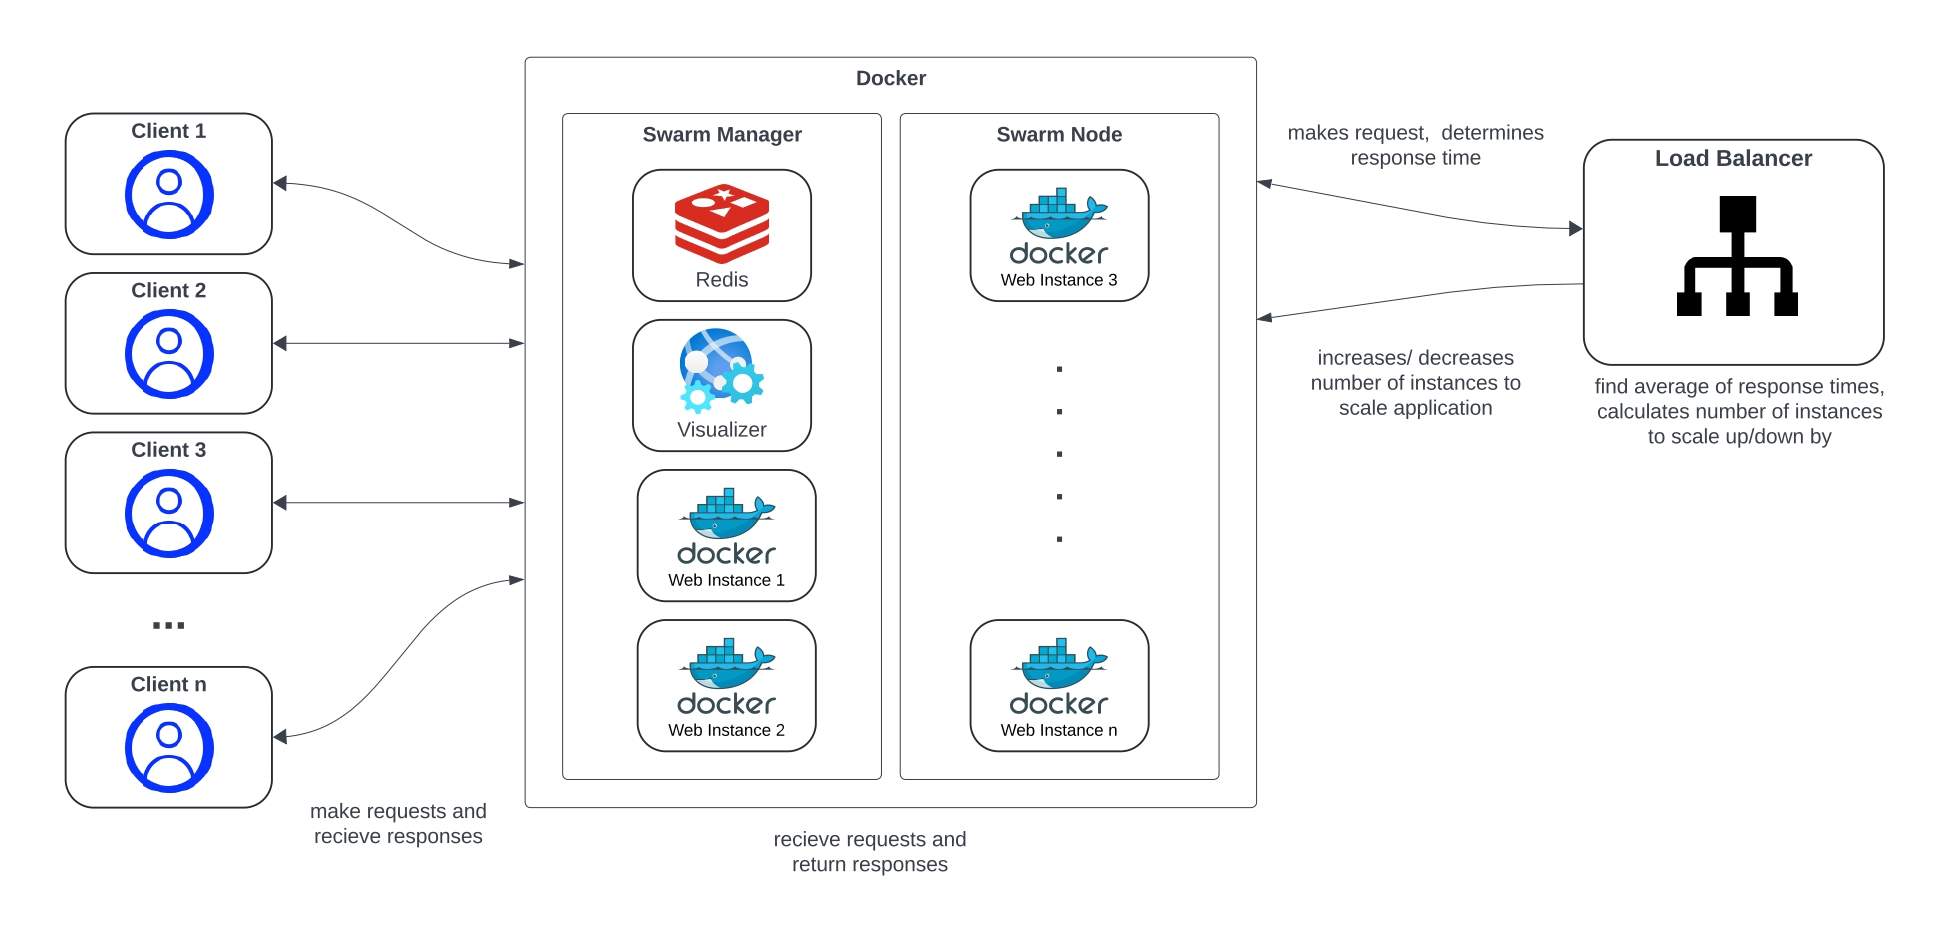
This project post outlines the design and development of a reactive auto-scaling engine for a cloud microservice application deployed on the Cybera infrastructure using Docker microservices. Using Python and Docker SDK, the auto-scaler engine continually monitors response times of a web microservice. Based on the average response time, the engine will dynamically horizontally-scale the docker microservice based on predefined lower and upper response time thresholds. Overall, the goal of the engine is to optimize performance by minimizing the response time for users as well as the operational cost on the cloud.
Horizontal Scalling
Scaling in cloud computing is essential for efficient infrastructure management. Scaling refers to the ability to increase or decrease resources as needed to meet changing demand. This eliminates the need to over-provision resources upfront to handle peak levels of user activity, thereby minimizing operational costs. Horizontal scaling refers to the ability for an application to automatically scale by adding or reducing computing nodes according to the workload.
Technologies, Methodologies & Tools
Terraform
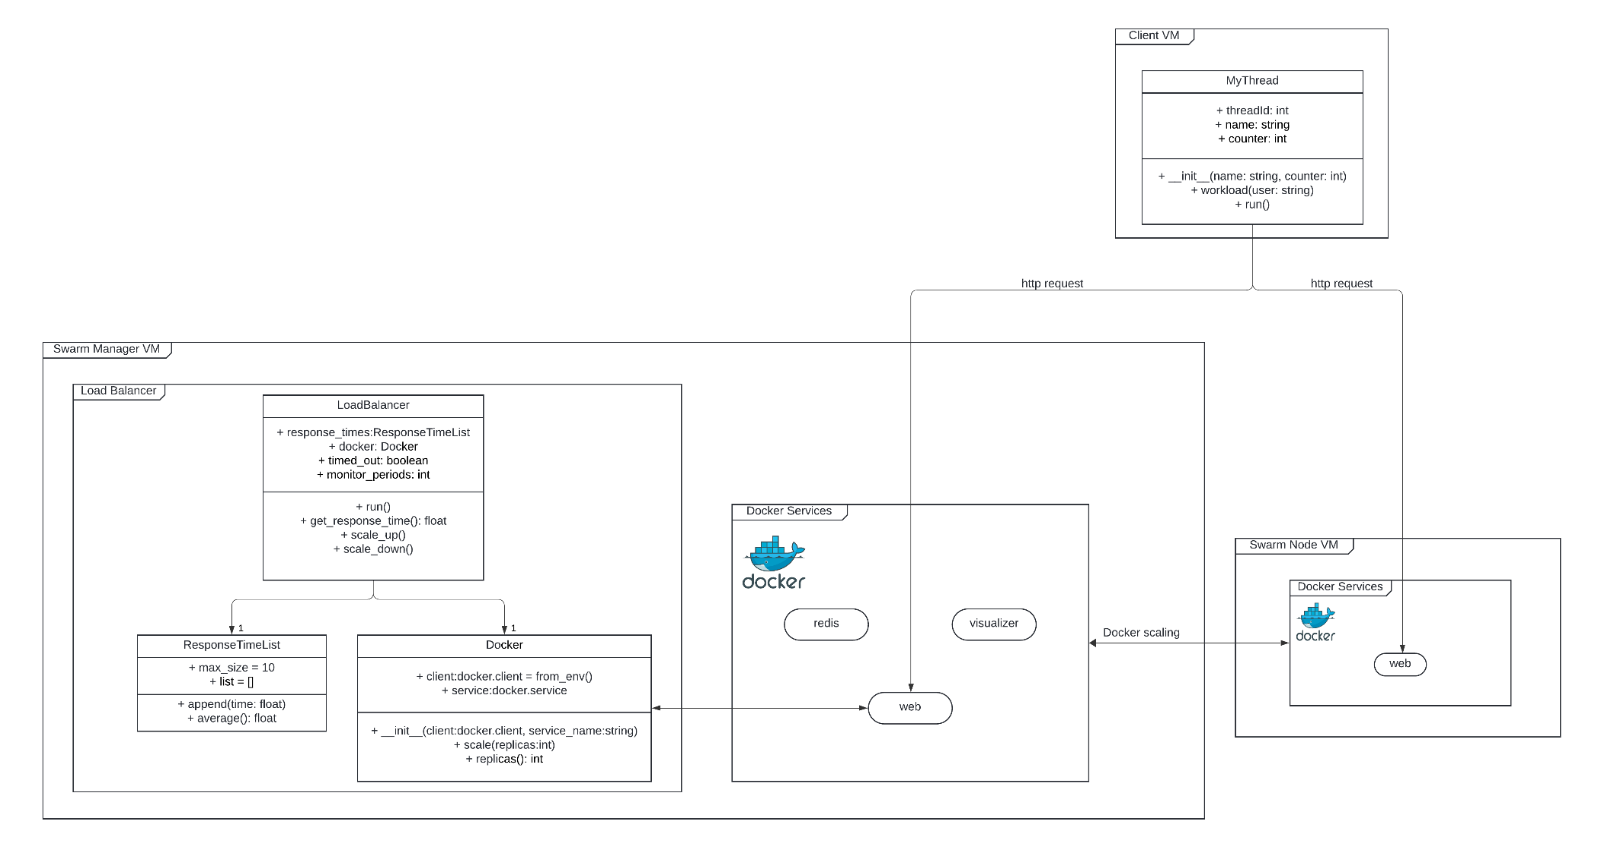
Terraform was used to provision and manage the cloud infrastructure hosted on Cybera. By using the OpenStack provider,security groups rules, keypairs and instances were provisioned.
Docker
Docker swarm mode was used in both the swarm manager VM and swarm node VM. This allowed declaring the number of replicas for the web microservice, scaling the service up or down. The swarm manager automatically distributes the replicas between both VMs.
Python
Python was used as the main programming language for the auto-scaling engine. The specific Python version of our autoscaler is Python 3.8.
The main reason for choosing Python was due to its Docker Engine API support. The Docker SDK for Python library was used to interact with the Docker engine to scale the web service.
Locust
Locust was chosen as the main load testing tool. Locust allowed testing the auto-scaler engine with a bell-shaped workload. Additionally it provided vital information such as average response time and charts for total request per second, response times and number of users.
Design
Response Times
The auto-scaling engine retrieves the response time of the Docker web service by doing an HTTP GET request and timing the response as shown below
t0 = time.time()
requests.get(f"http://{self.config['host']}",
timeout=(self.config["upper_threshold"] * 2))
t1 = time.time()
The request timeouts if the response takes longer than double the predefined upper threshold. If this occurs, the response time is noted down as 2*upper_threshhold for future calculations. This method was chosen to avoid unresponsive and hanging responses.
Average Response Times
As the engine retrieved response times, the average response time was calculated by dividing the sum of all response times by the total of all response times as shown below.
class ResponseTimeList:
    def __init__(self, max_size):
        self.max_size = max_size
        self.list = []

    # will delete oldest entry to maintain max_size length
    def append(self, time):
        self.list.append(time)
        if len(self.list) > self.max_size:
            self.list.pop(0)

    def average(self):
    return sum(self.list) / len(self.list)
Scaling Calculations
The number of replicas to scale is determined dynamically by an equation. For scaling up, the number of replicas to add equals the average response time divided by the upper response threshold, rounded to the nearest integer. For scaling down, the number of replicas to remove equals the lower threshold divided by the average response time, rounded to the nearest integer. This allows the number of replicas to increase or decrease by multiple replicas in proportion to how much the average response time exceeds or subceeds the allowed thresholds. This equation was determined through testing and experimentation.
Monitor
In order to avoid oscillation, the engine was set to monitor the response times for multiple polling intervals after scaling. This allows the engine to find a better response time average for future scale operations and prevents it from scaling after every polling interval.
Configuration
poll_interval: 5
time_array_length: 6
min_replicas: 1
max_replicas: 30
service_name: app_name_web
host: "10.2.9.11:8000"
monitor_periods: 2
# Acceptable response time
upper_threshold: 4.5
lower_threshold: 2
Pseudocode
Start of Program

Set the configuration variables
    poll_interval
    min_replicas
    max_replicas
    service_name
    host_IP
    upper_threshold
    lower_threshold
    num_reqs_for_average
    monitor_intervals

Set reponse_times_array[num_reqs_for_average]

define get_response_time()
    make request to host
    return time_after_request - time_before_request

loop:
    response_times_array.append(get_reponse_time())
    avg_response_time = average(reponse_times_array)

    if no need to wait intervals:
        avg_response_time > upper_threshold and num_active_dockers < max_replicas:
            scale_up(num_reps_to_add = round(avg_response_time / upper_threshold))
            then monitor for 2 intervals
        else if avg_response_time < lower_threshold and num_active_dockers > min_replicas:
            scale_down(num_reps_to_remove = round(lower_threshold / avg_response_time))
            then monitor for 2 intervals
    else
        monitor_intervals - 1

    sleep(poll_interval);
    plot number of replicas

End of Program
Real-Time Plot
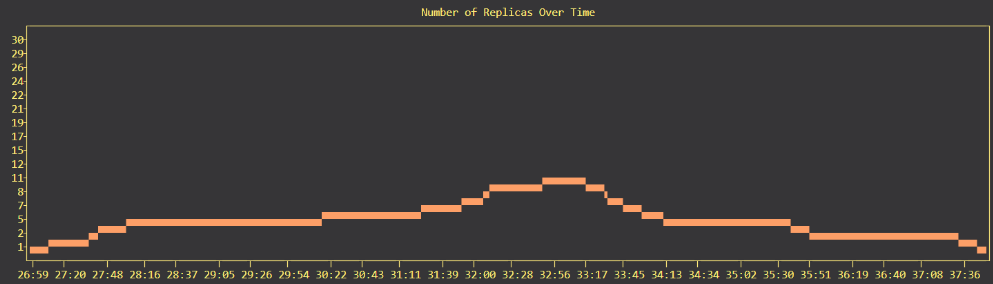
Locust was use for load testing the auto-scaling engine. The graph below shows the number of replicas over time as bell-shaped load was applied.